Unit 1: Building a Math Community through Real Data
Learning Target:
- I can represent and interpret data using whole numbers. (NC.4.MD.4)
- I will collect data by asking a question that yields numerical data.
- I will make a representation of data and interpret data in a frequency table, scaled bar graph, and/or line plot.
- I will determine whether a survey question will yield categorical or numerical data.
- data, categorical data, numerical data, survey questions, frequency table, scaled bar graph, line plot, range,
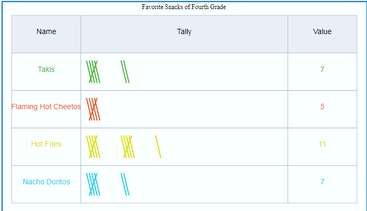
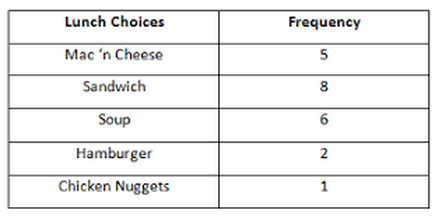
Frequency Tables:
- A frequency table may include tallies and/or numbers of the total data points for each category. Frequency tables help organize the data so it can be interpreted.
|
|
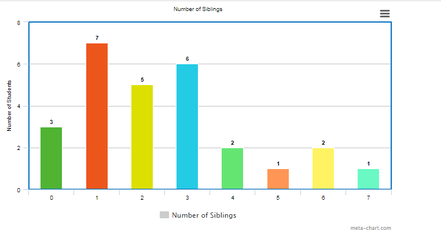
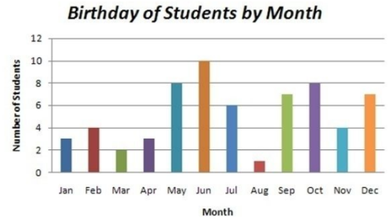
Scaled Bar Graphs:
- A scaled bar graph can be used to represent both categorical data and numerical data. Bar graphs should include: a title, x-axis label, y-axis label, and a scale for the frequency or count.
|
|
Line Plots: (Dot Plot)
- A line plot consists of numerical data. The total for each category is found by counting the number of Xs in each category. Line plots have a title, number line, labels, and a key.
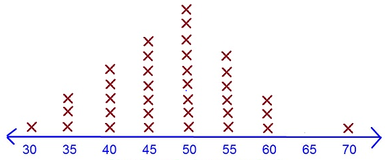
Number of Minutes Studying Multiplication Facts
|

|
Categorical Data (Qualitative Data):
- Categorical data values are most often written in words. Categorical data represents possible responses with respect to a given category. Categorical data represents characteristics such as a person's gender, hometown, or the types of movies they like. This type of data can be displayed using a scaled bar graph or a line plot.
- Months in which people have birthdays,
- Favorite Color,
- Favorite Food,
- Kinds of Pets,
- Numerical data has values that are numbers such as counts and measurements. Numerical data represents objects or individuals by numbers and is used when collecting measurable properties, such as time, height, weight, amount, and so on. This type of data is best displayed on a line plot.
- Number of children in a family,
- Time students spend doing their homework,
- Weight of newborn babies,
- The distances people jumped,
- size of people's feet,
Songs & Videos:
|
|
|
Student Interactives & Games:
- Flipgrid Data Collection
- StudyJams-Bar Graphs
- StudyJams-Line Plots
- StudyJams-Choosing the Correct Graph
- StudyJams-Range of Data
- Graphmaster-Mr.Nussbaum Games
- Ice Cream Graphing Game-Mr. Nussbaum Games
- Bar Graphing with Roly-Education.com
- Scaled Bar Graphs in Space-Education.com
- Zap & Kreb Graphing Word Problems-Education.com
